

Thu, 03/21/2019 - 12:55
Forums:
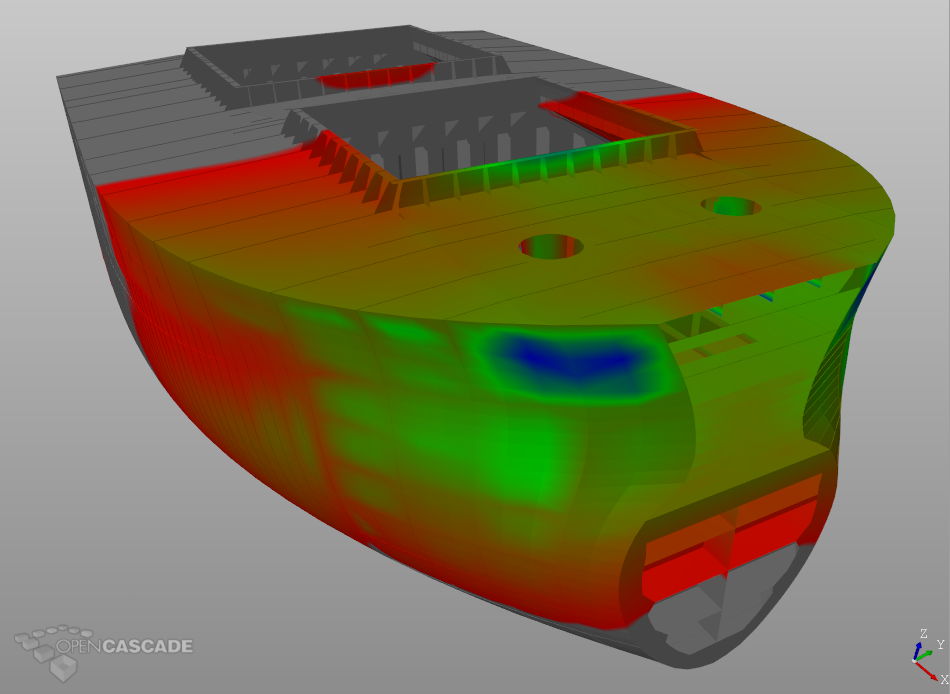
I want to demonstrate a temperature distribution on a Geom_BSplineSurface as shown in the attachment in Opencascade documentation https://www.opencascade.com/content/visualization. I have data stored in a 2D vector for each coordinate in uv frame. Please let me know if anyone managed to do this using Opencascade. Thanks in advance.
Attachments:
Fri, 03/22/2019 - 21:56
You can try using MeshVS_Mesh (MeshVS_NodalColorPrsBuilder), AIS_Triangulation presentations (with vertex color option) or create own AIS_InteractiveObject sub-class implementing Compute() routine.